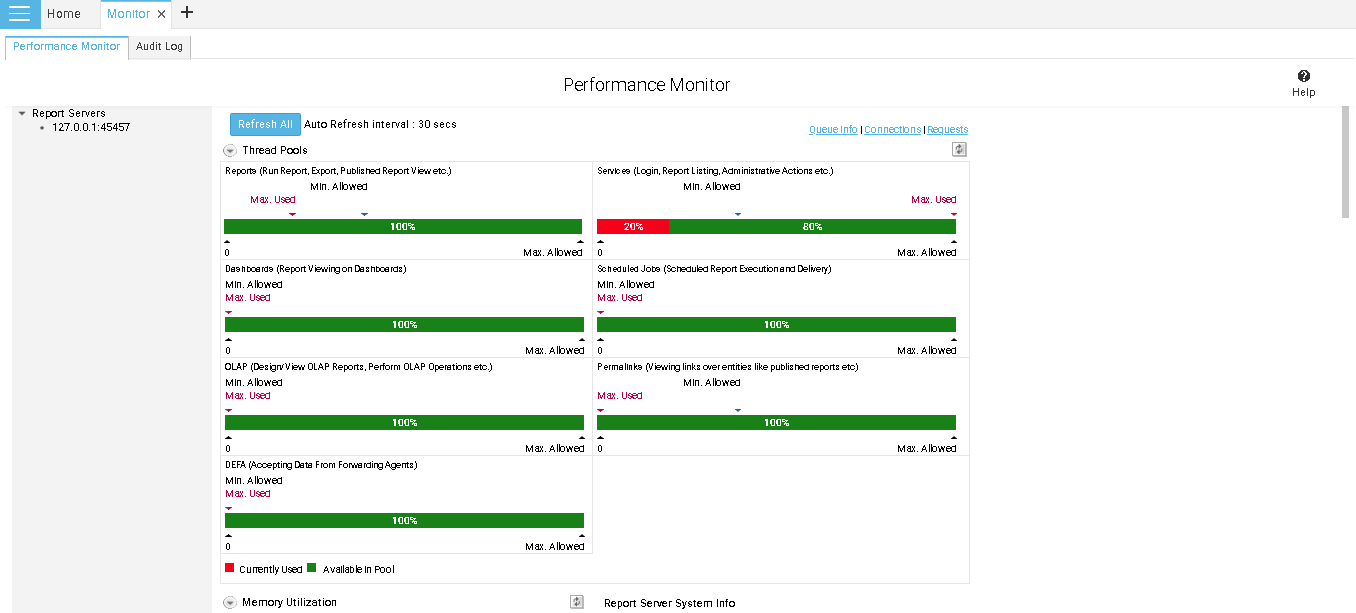
Performance Monitor is the tool used to analyze and understand the impact of Intellicus workload on the system resources. It works by capturing snapshots of resource utilization at the specified interval.
Performance Monitor displays status of processes that are critical to Intellicus’ performance.
With Intellicus performance monitoring, data is collected for all activities in real time. For example, each time a user logs on or runs a report or query, the activity is tracked as it happens. The real-time data makes it easier to identify performance problems and non-optimized areas of the system.
Click Navigate > Administration > Monitor > Performance Monitor tab to open the Performance Monitor page.
The list of IPs on the left of the page, are the report server(s) running. Click the server IP to get the details on right side of the page.
You can see the number of threads used by the Report Server like report execution threads, threads used for communication between server and clients, threads used for report run request from dashboard, etc. You can also view RAM utilized on the selected Report Server, version of JRE installed on Report Server, name and version details of OS running, time for next audit log purge and next cache purge.
You can view used, allowed etc. values for various entities on mouse hover. Also, these values are indicated in colors across all sections of Performance Monitor.
Figure 1: Performance Monitor page
Navigation across Performance Monitor
Refresh All
Click Refresh All button to refresh all the information on Performance Monitor page.
Performance Monitor also auto-refreshes at a set time interval. This can be set from Administration > Configure > Portal Menu page on the portal.
Queue Info
Click Queue Info link to jump to Request Queues section of Performance Monitor.
Connections
Click Connections link to jump to Connection Pools section of Performance Monitor.
Requests
Click Requests link to jump to Request Level Info section of Performance Monitor.
The list of IPs on the left of the page, are the Intellicus Report server(s) and cluster servers currently configured through Load balancer. Click the server IP to get the details on right side of the page.
We will discuss more about Queue Info, Connections and Requests sections later in this document.
Refresh button

All the sections have Refresh button on section header. Click button to refresh information on respective section.
Clicking the Top hyperlink would take you to the top of the Performance Monitor screen.
Threads Pool
Knowing when jobs are queued up waiting for threads from a job pool is very helpful for identifying and resolving performance bottlenecks.
Figure 2: Threads pool section
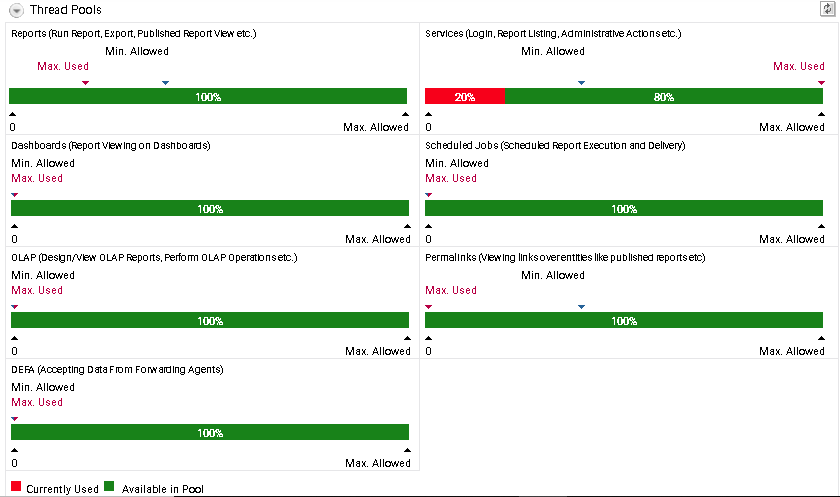
You can see the number of threads used by the Report Server for below jobs:
Reports
These are report execution threads. These are used when a report run, export etc. request is served. One thread will be used each time a report is run.
Dashboards
These threads are used when a report run request coming from dashboard is served. One thread will be used for each of such request.
OLAP
These are the threads that are used to design/view OLAP reports and perform OLAP operations.
DEFA
These threads are used while receiving data from the forwarding agents.
Services
These are the threads that are used for communication between Intellicus server and clients.
Scheduled Jobs Thread
These threads are used when a report execution and delivery is scheduled.
Permalinks Thread
These threads are used when viewing links over entities like saved reports etc.
Each thread pool has the below indicators:
Minimum Allowed: A marker on the indicator marking minimum number of threads that will be used.
Maximum Used: A marker on the indicator marking the maximum number of threads used after Intellicus server was started.
Maximum Allowed: A marker on the indicator marking maximum number of threads that can be used. This number is controlled by license.
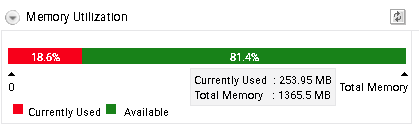
Memory Utilization
This section indicates the RAM utilized out of the total memory available on Report Server.
Figure 3: Section of memory utilization
Report Server System Info
Provides version of JRE installed on Report Server, name and version details of OS running on Report Server, time for next audit log purge and next cache purge.
Figure 4: Report Server System info section

Request Queues
Maximum number of threads that can be executed is limited by set properties and license. If the number of threads are less than or equal to the maximum number, they are executed. All additional threads are queued.
Figure 5: Request Queues section

Information about following queues are displayed:
Pending: Number of pending requests in the main pending queue.
Execution: Number of pending requests in Execution queue.
Scheduler: Number of pending requests in Scheduler queue.
Services: Number of pending services threads.
Dashboard: Number of pending requests in Dashboard queue.
Connection Pools
This section provides following information for each of the data connection:
Name: Data connection name.
Database user: The user ID used to login in the database.
Pool Status: Chart indicating use / availability of threads on a connection. Chart indicates initial pool size, maximum used and maximum allowed.
Metadata Cache Status: Displays metadata caching status of Table, View, Procedure etc.:
Cached: Caching completed
Caching: Caching is going on
Caching Due: Caching yet to start.
Caching failed: Intellicus tried caching metadata but could not.
Figure 6: Connection Pools section

Request Level Info
The line chart shows the number of requests served at a time. Number of requests served in 10 minutes of interval. The chart is plotted based on information of last 100 minutes.
The table below the chart shows the requests currently being served. You can click Kill button of respective row to stop the process.
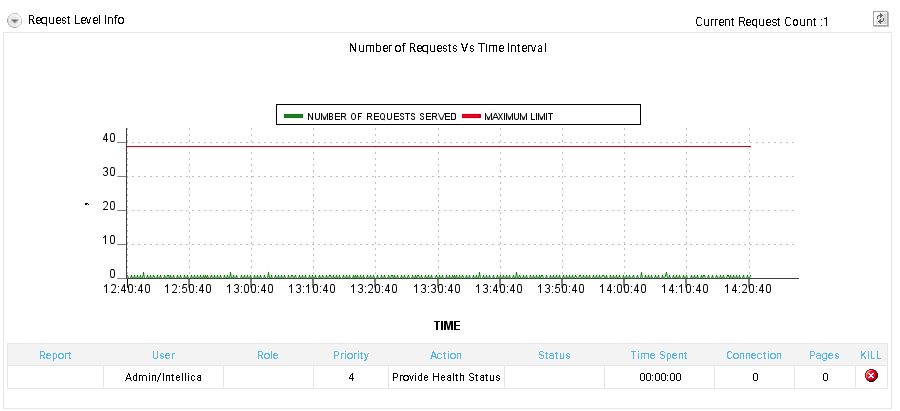
Figure 7: Request Level Info section